Portfolio
Final Project Part 1
Intro and Outline
At first, I wanted to tell a story about the importance of predators in ecosystems and how they intersect with human life. I was going to pick a few predators–some more well known (grey wolves, otters) than others (martens, sunflower sea stars, wolverines)–and document how changes in their population and distribution change the ecosystem and landscape.
However, I quickly learned that it isn’t easy to come by detailed geographic data about species people don’t care about. So instead, I will be focusing on an environment that is comparatively well-studied: kelp forests off the coast of California.
I am interested in showing the overall health of kelp forests over time. I want to do so by proxy, highlighting the health of two keystone predators, sea otters and sunflower sea stars, and how they interrelate with kelp forest abundance overall. I expect to see that as otter populations rise from the mid-1980s into the 2010s (Tinker & Hatfield, 2016), kelp forests will grow or remain the same size, but after the sunflower sea star wasting syndrome killed roughly 90% of the population (Gravem et al., 2021) they will shrink. I want to show how this is because of how the otters and sea stars (as well as other urchin-eating predators) regulate the dynamic between kelp forests and urchins.
Since urchins feed on kelp, predation is required to ensure that urchins do not overgraze and destroy kelp forests entirely. When otter and sunflower sea star populations are at relatively normal levels, kelp forests may fluctuate in size and density but remain stable on average. Since the 1980s, sea otters have been a central focus of marine conservationists, both for their own sake and for the sake of preserving kelp forests. However, in absence of the sunflower sea star (Pycnopodia helianthoides) they are unable to singelhandedly prevent a trophic cascade within kelp ecosystems, leading to the rapid replacement of kelp forests with urchin barrens (Joshua et al., 2021). This, in combination with warming waters due to climate change (Roggers-Bennett & Catton, 2019), has significantly reduced the biomass of kelp forest.
Initial Sketches
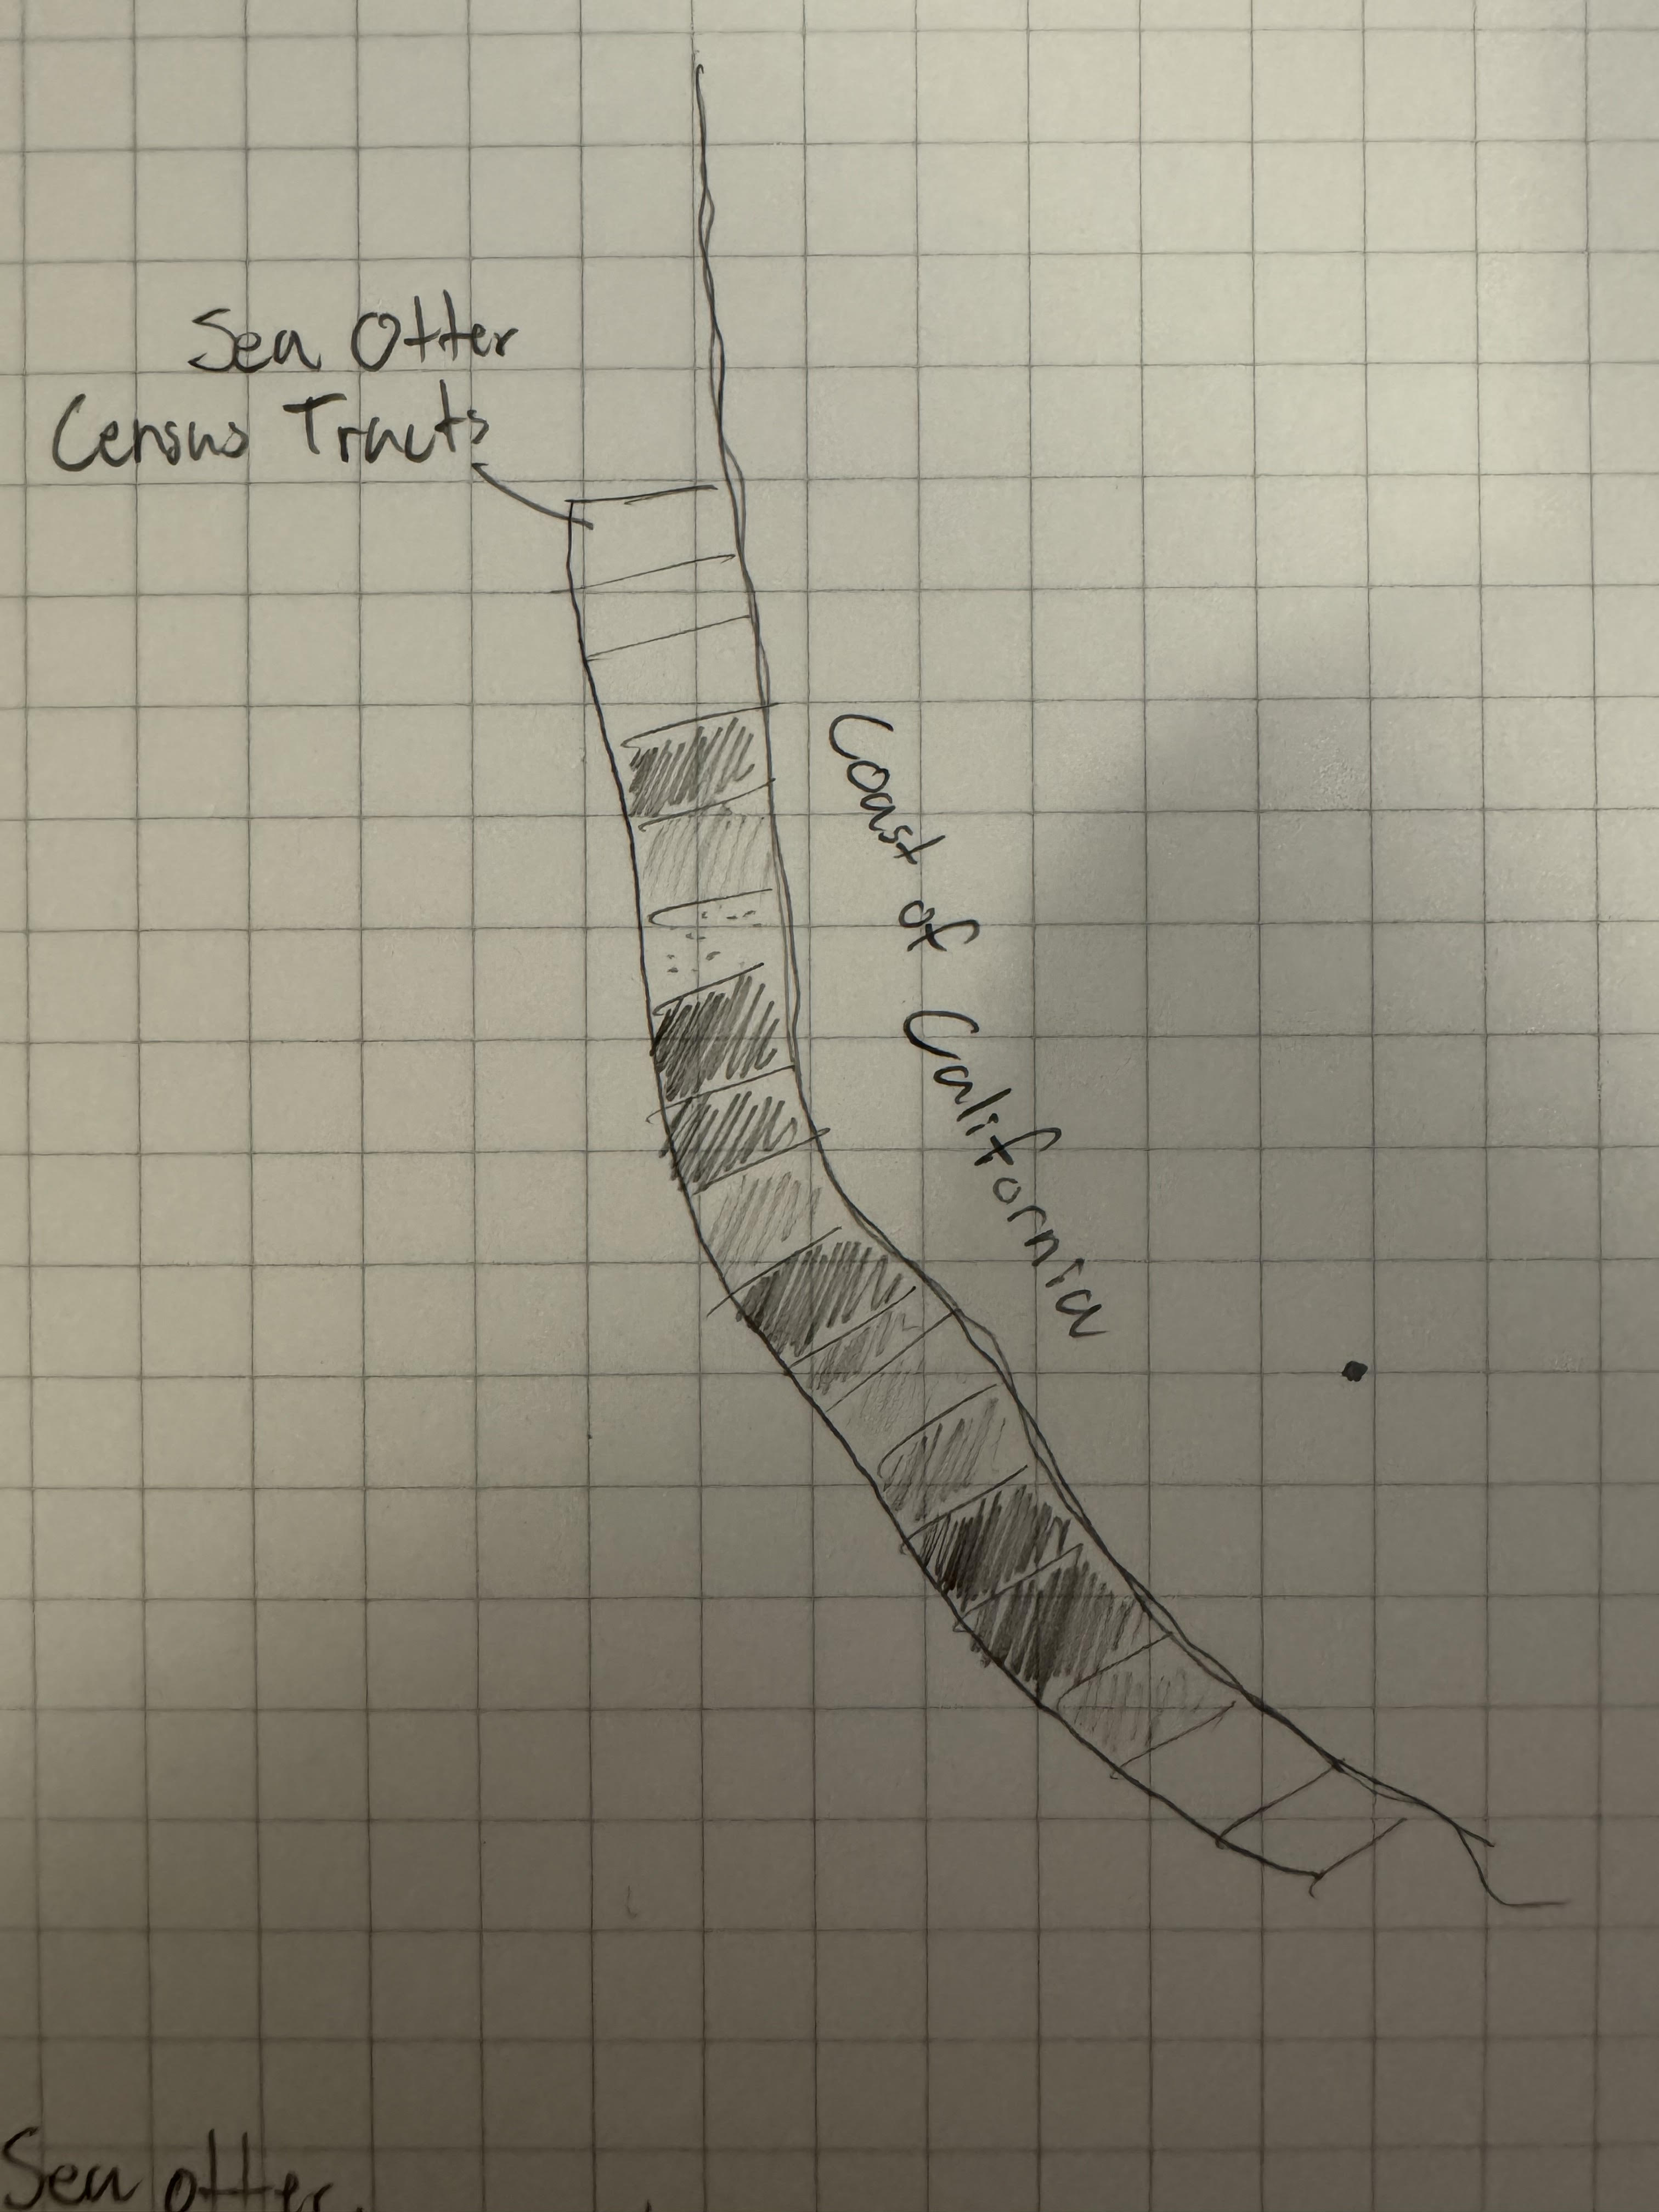 For this first sketch, I want to take the annual Sea Otter Census Tract data and make a diverging heat map. Just picking two colors, orange could represent tracts where otter populations have decreased since the begining of the census and blue could represent tracts where their populations have increased.
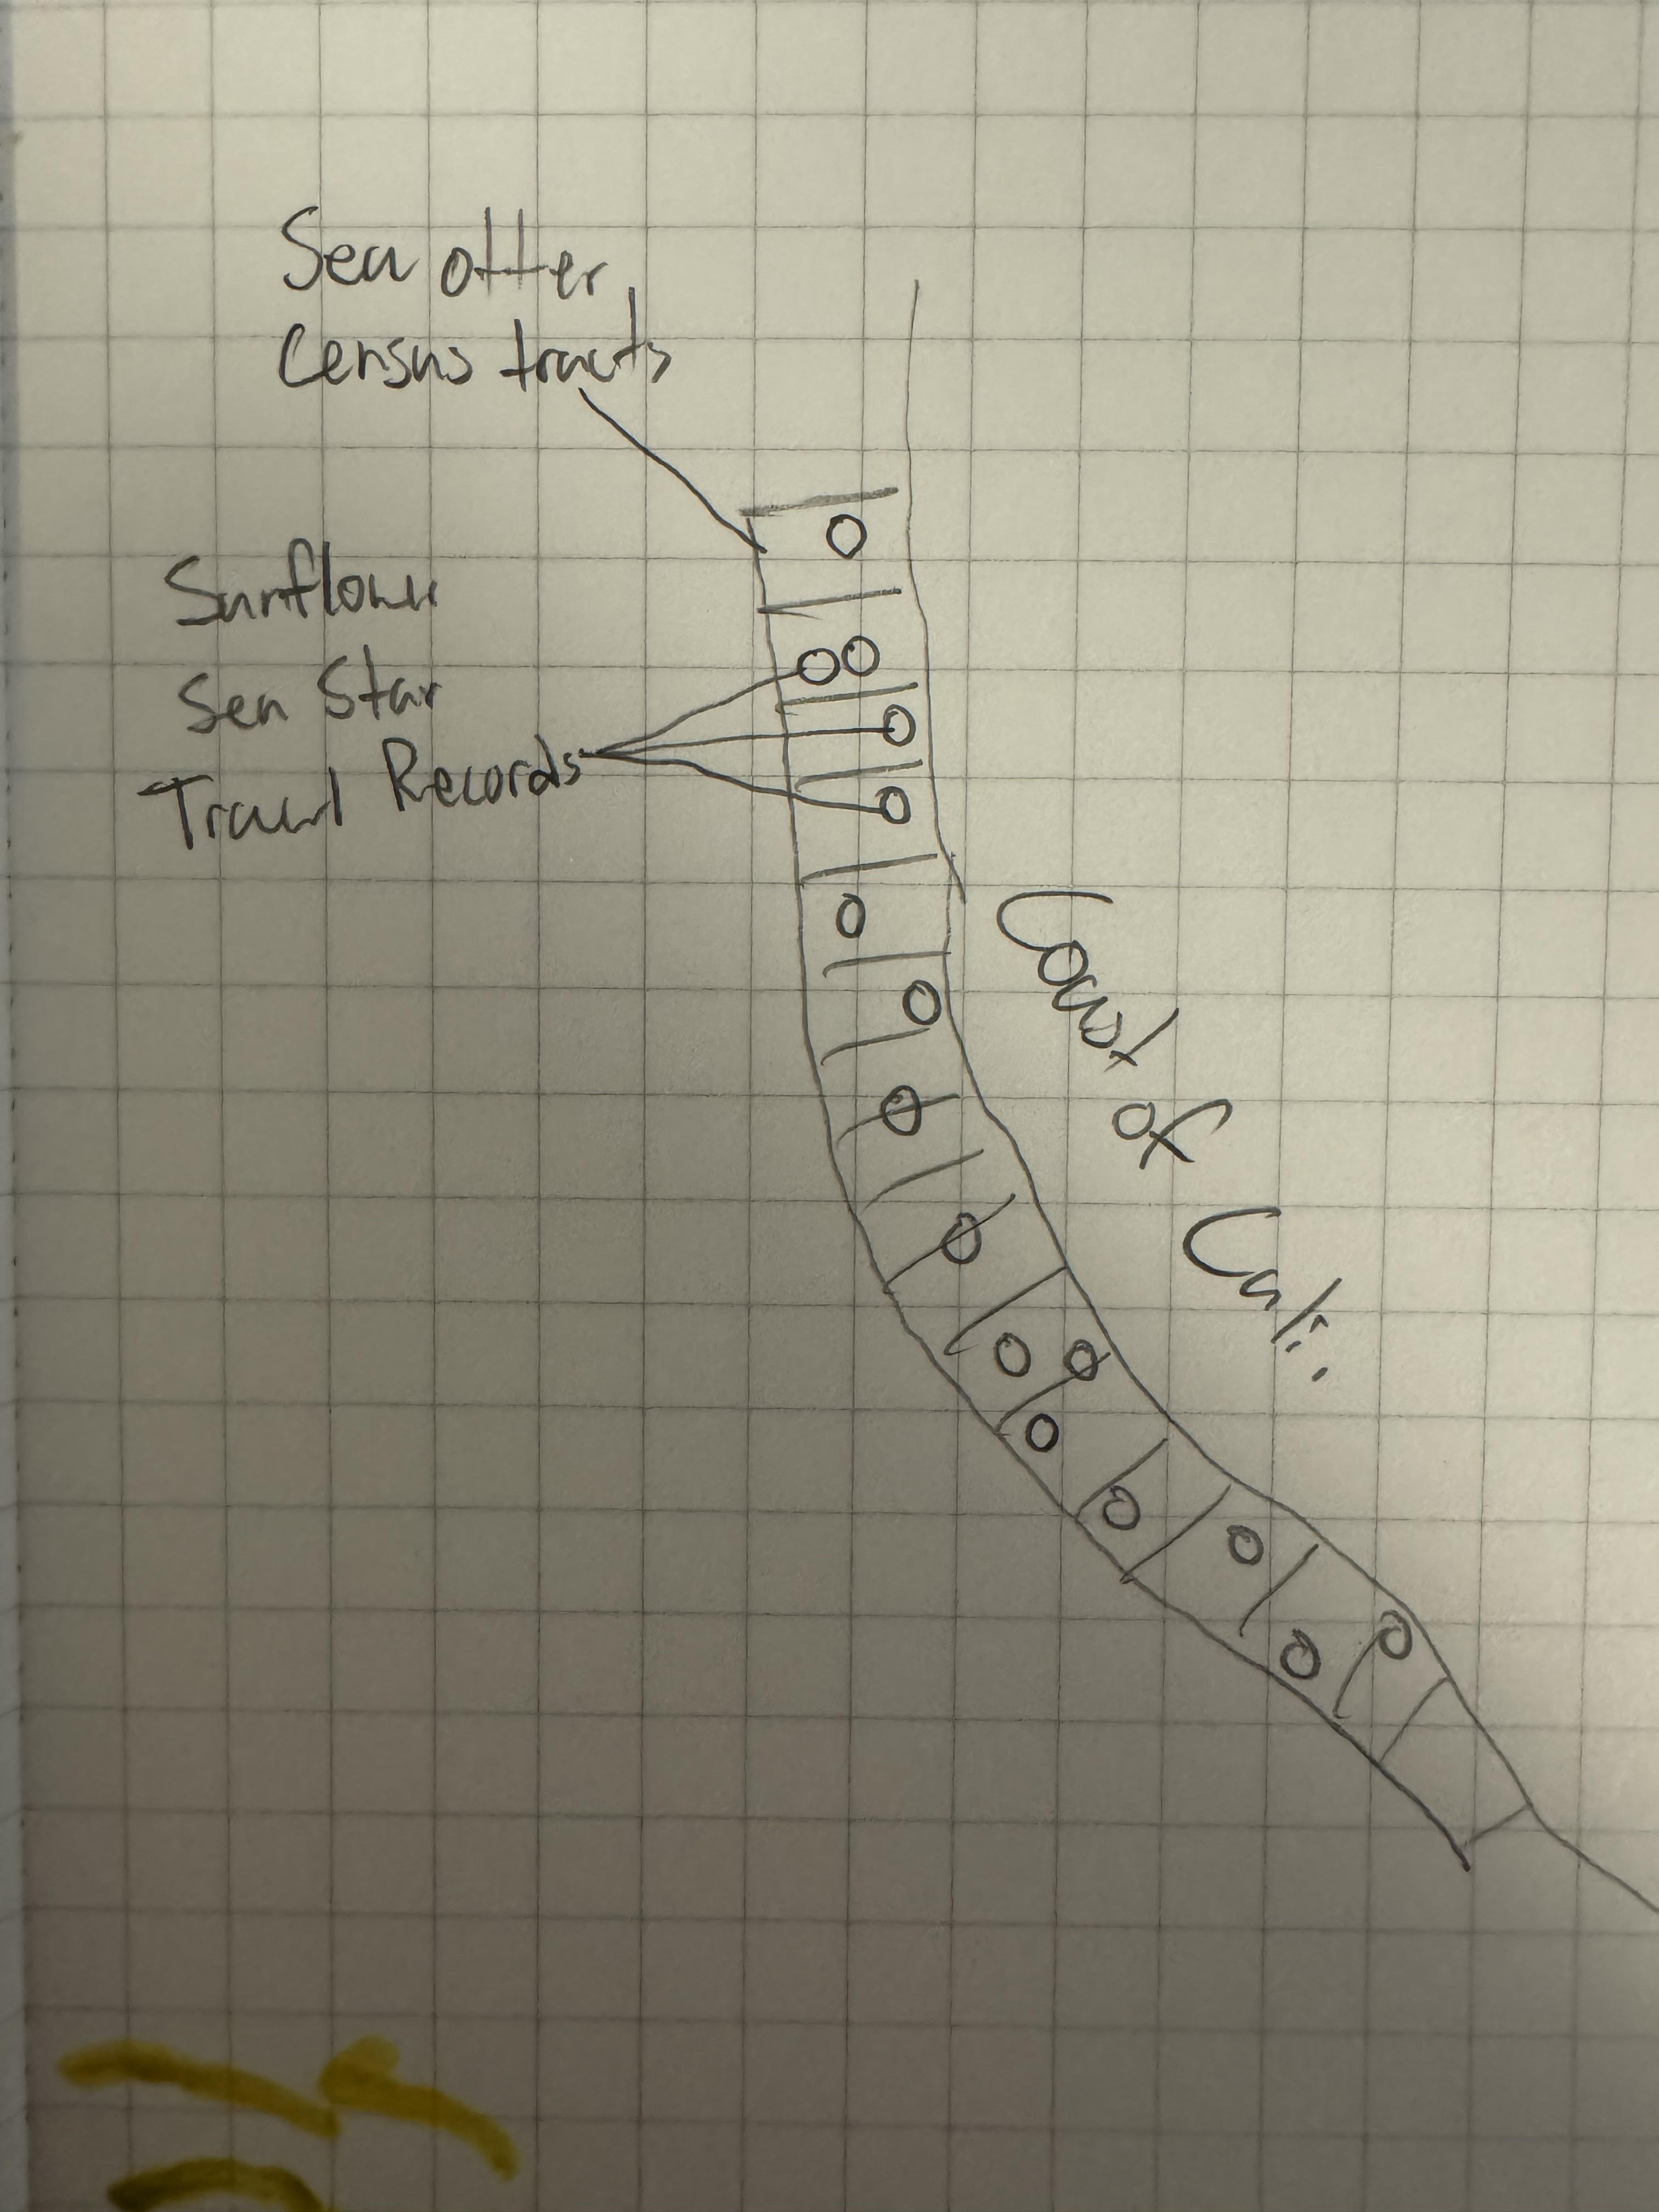 To add onto the first sketch, I would also like to join trawl record data of sunflower star fish and (not included in sketch) raster data for aerial kelp forest surveys to see what patterns emerge. As per Joshua et al. (2021), I expect to see kelp forests hanging on where otter census tracts contain high densities of sea otter population.
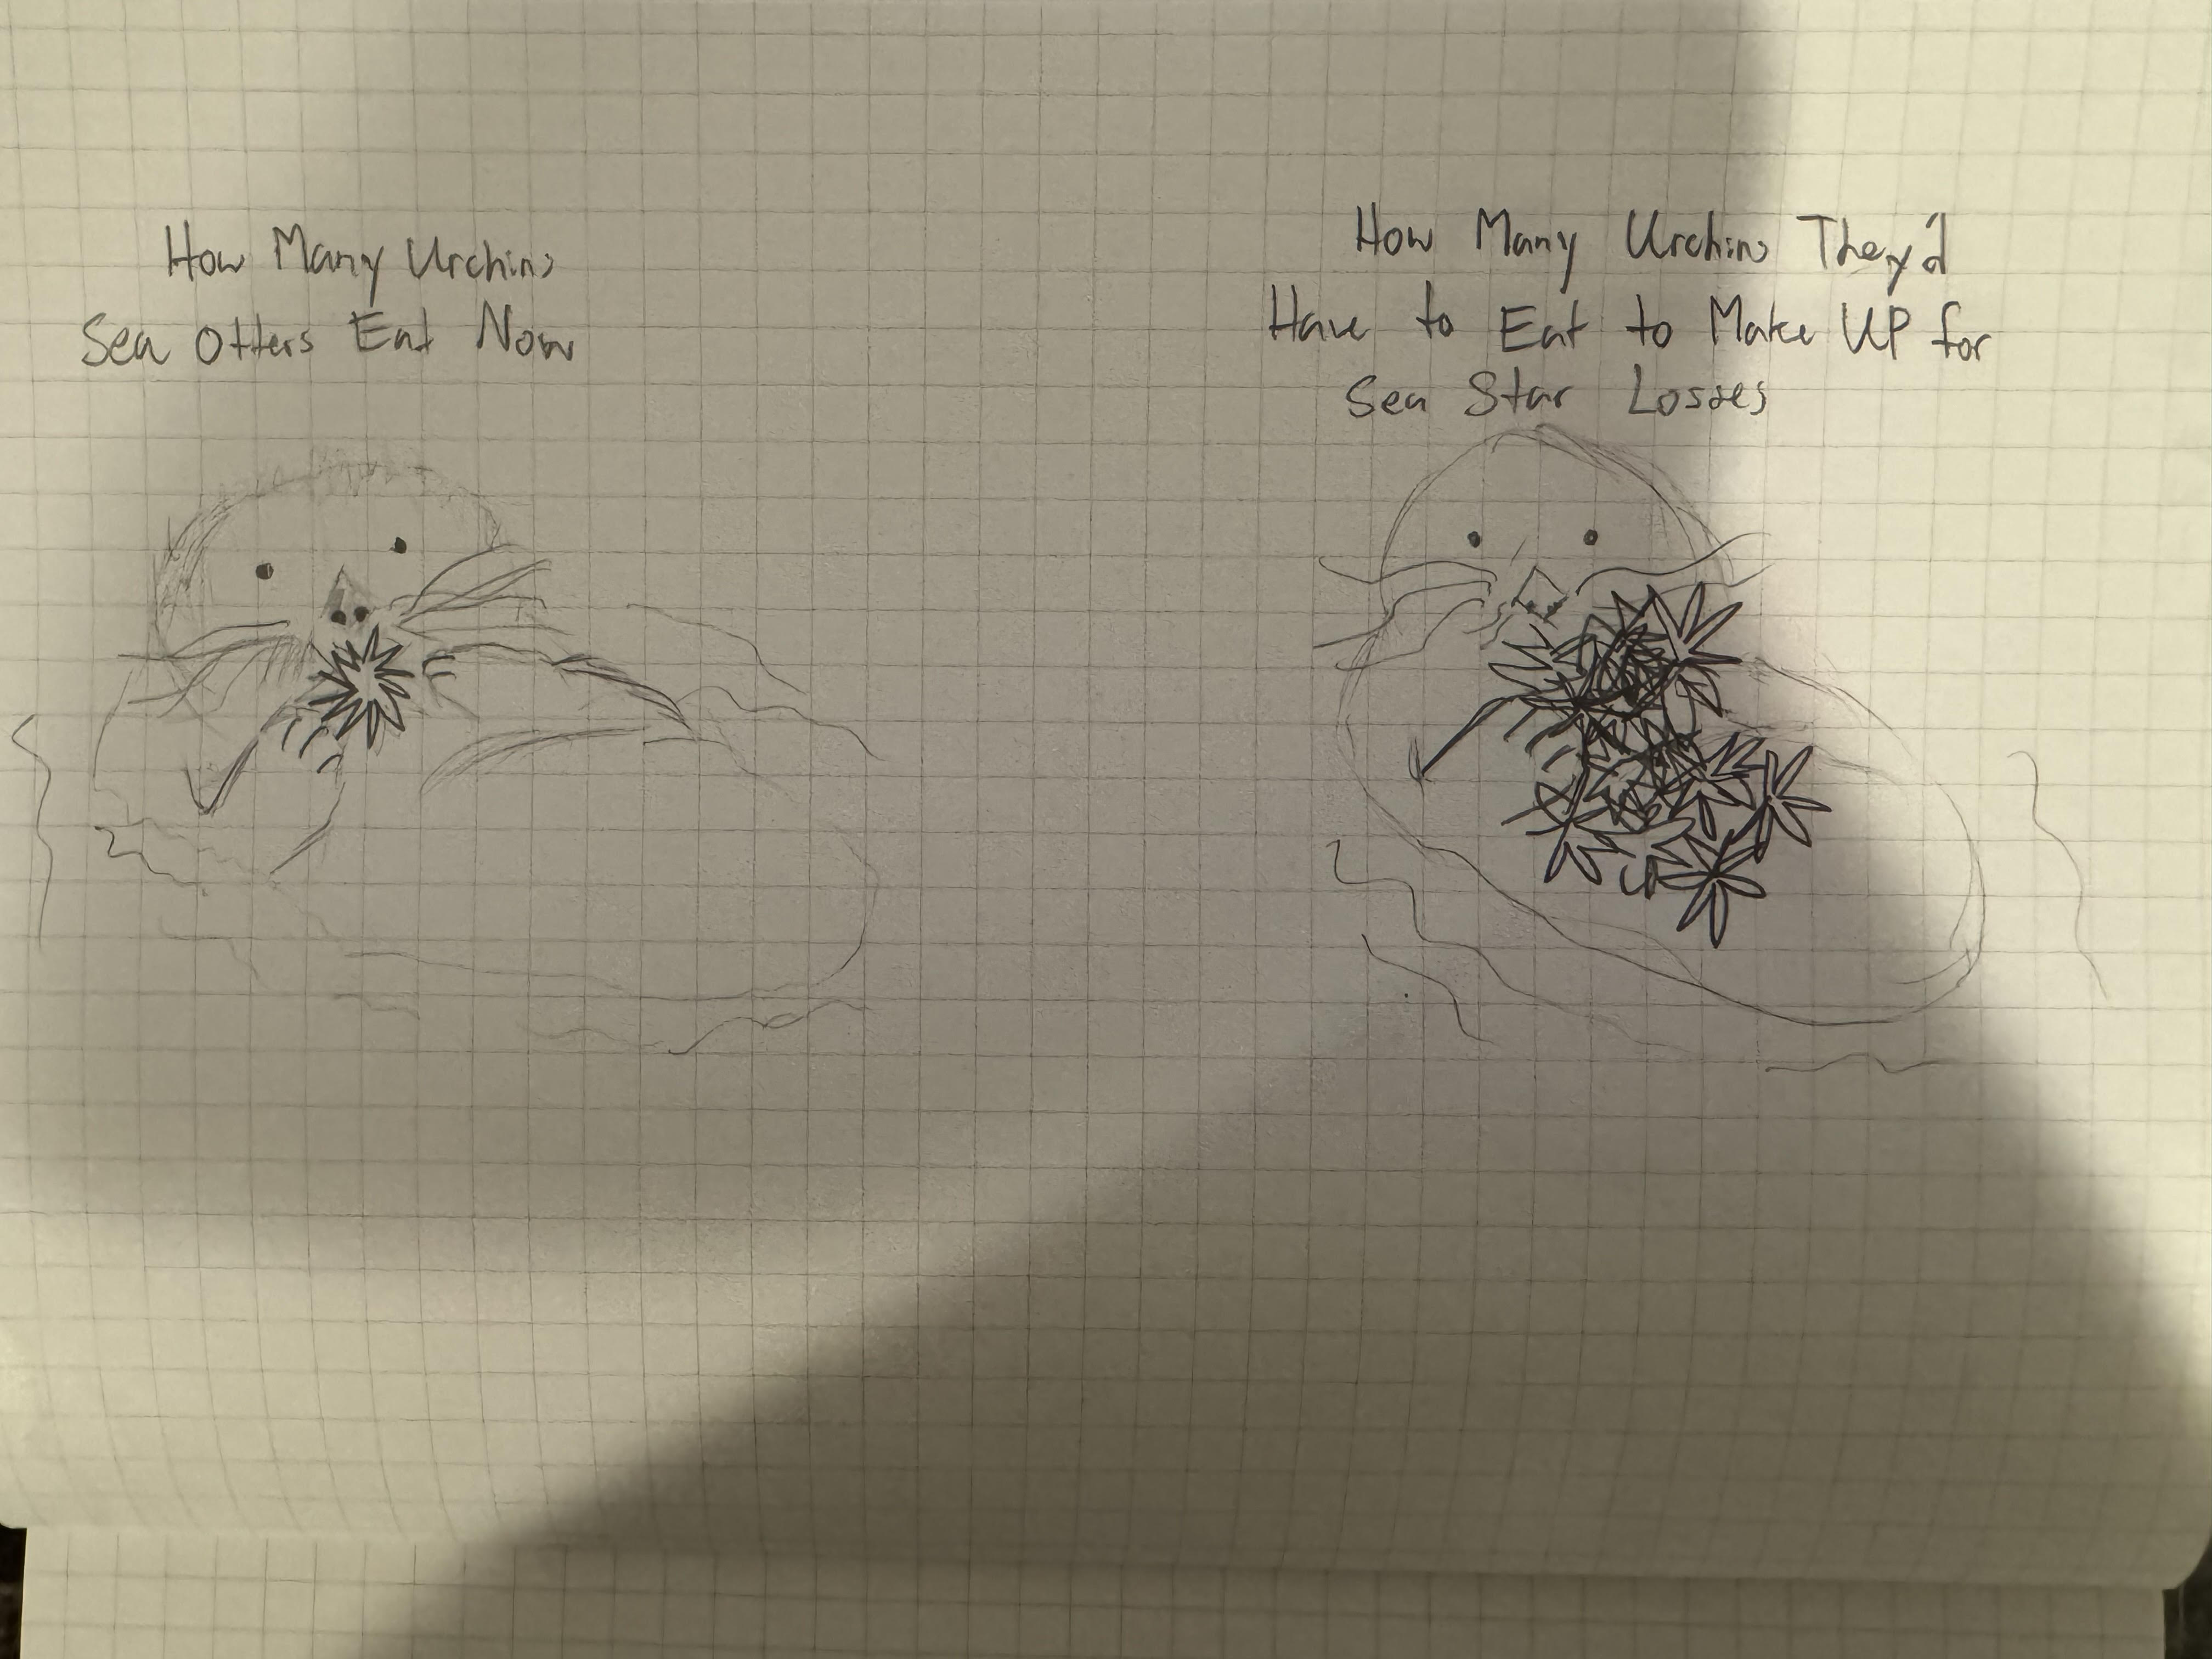 I also want to do something a bit more dramatic, a bit more in-your-face to demonstrate the scale of the urchin barrens. Here, we have an otter eating what they would normally eat on the left, and on the right is what that otter would have to eat to make up for the missing star fish. With this I hope to demsontrate not only the magnitude of the problem but also that ecosystems, while often resilient, are also sensetive to the removal of key ecological regulators.
The Data
I plan to use three datasets to generate my visuals.
- Trawl records and biomass records of sunflower starfish from before and after the 2013 onset of the starfish wasting syndrome pandemic (Caldwell et al., 2019)
- Kelp forest aerial survey map data from 1984 until 2024 (ongoing) (Bell et al., 2024)
- Sea Otter Census data from 1985 to 2020 (Tinker & Yee, 2020)
I want to join the geographical data of each into one map of the West Coast of the US, focusing on California. I will use this to create various heat maps focusing on the increase or decline of the included species by each Sea Otter Census tract. As previously mentioned, I would like to see how the presence of otters increases resilience of remaining kelp forests along the West Coast. Beyond mapping, I also want to create vizualizations that indicate the scale of biomass loss, namely using line charts, bar charts, and unit charts.
Although I have not yet found geographic data on sea urchin barrens to use for mapping, the data I currently have is sufficient to tell my story, and I have no doubt that I can find urchin data over the course of this project.
Method & Medium
For mapping, I plan on using ArcGIS Pro to compile and illustrate data trends. For other vizualizations, I intend on using tableau. For the overall presentation, I will likely use Shorthand, but I may pivot toward ArcGIS Story Maps since that platform may work better with my maps.
References
Bell, T., Cavanaugh, K. & Siegel, D. (2024). SBC LTER: Time series of quarterly NetCDF files of kelp biomass in the canopy from Landsat 5, 7 and 8, since 1984 (ongoing) ver 23. Environmental Data Initiative. https://doi.org/10.6073/pasta/2c1218b7ebe6967da52000adf02f6a8b
Caldwell, J., Montecino, D., Pattengill-Semmens, C., Harvell, D. & Gaydos, J. (2019). Dataset of Pycnopodia helianthoides abundance shallow nearshore waters from REEF and the sea surface temperature, as well as the data for the abundance of this species at deep offshore waters.. figshare. Dataset. https://doi.org/10.6084/m9.figshare.7300409.v3
Gravem, S. A., Heady, W. N., Saccomanno, V. R., Alvstad, K. F., Gehman, A. L. M., Frierson, T. N. & Hamilton, S.L. 2021. Pycnopodia helianthoides (amended version of 2020 assessment). The IUCN Red List of Threatened Species 2021: e.T178290276A197818455. https://dx.doi.org/10.2305/IUCN.UK.2021-1.RLTS.T178290276A197818455.en
Joshua, G. S, Tomoleoni, J., Staedler, M., Lyon, S., Fujii, J. & Tinker, M. T. (2021) Behavioral responses across a mosaic of ecosystem states restructure a sea otter–urchin trophic cascade. Proceedings of the National Adacemy of Sciences, 118(11). https://doi.org/10.1073/pnas.2012493118
Rogers-Bennett, L., Catton, C. A. (2019) Marine heat wave and multiple stressors tip bull kelp forest to sea urchin barrens. Scientific Reports 9, 15050. https://doi.org/10.1038/s41598-019-51114-y
Tinker, M. T. & Hatfield, B. B. (2016) California sea otter (enhydra lutris nereis) census results, spring 2016. US Geological Survey. https://pubs.usgs.gov/ds/1018/ds1018.pdf
Tinker, M. T., and Yee, J. L. (2020) Annual California Sea Otter Census. US Geological Survey. https://www.sciencebase.gov/catalog/item/5601b6dae4b03bc34f5445ec